Profilometry (statistics on bundles)
Defining profilometry
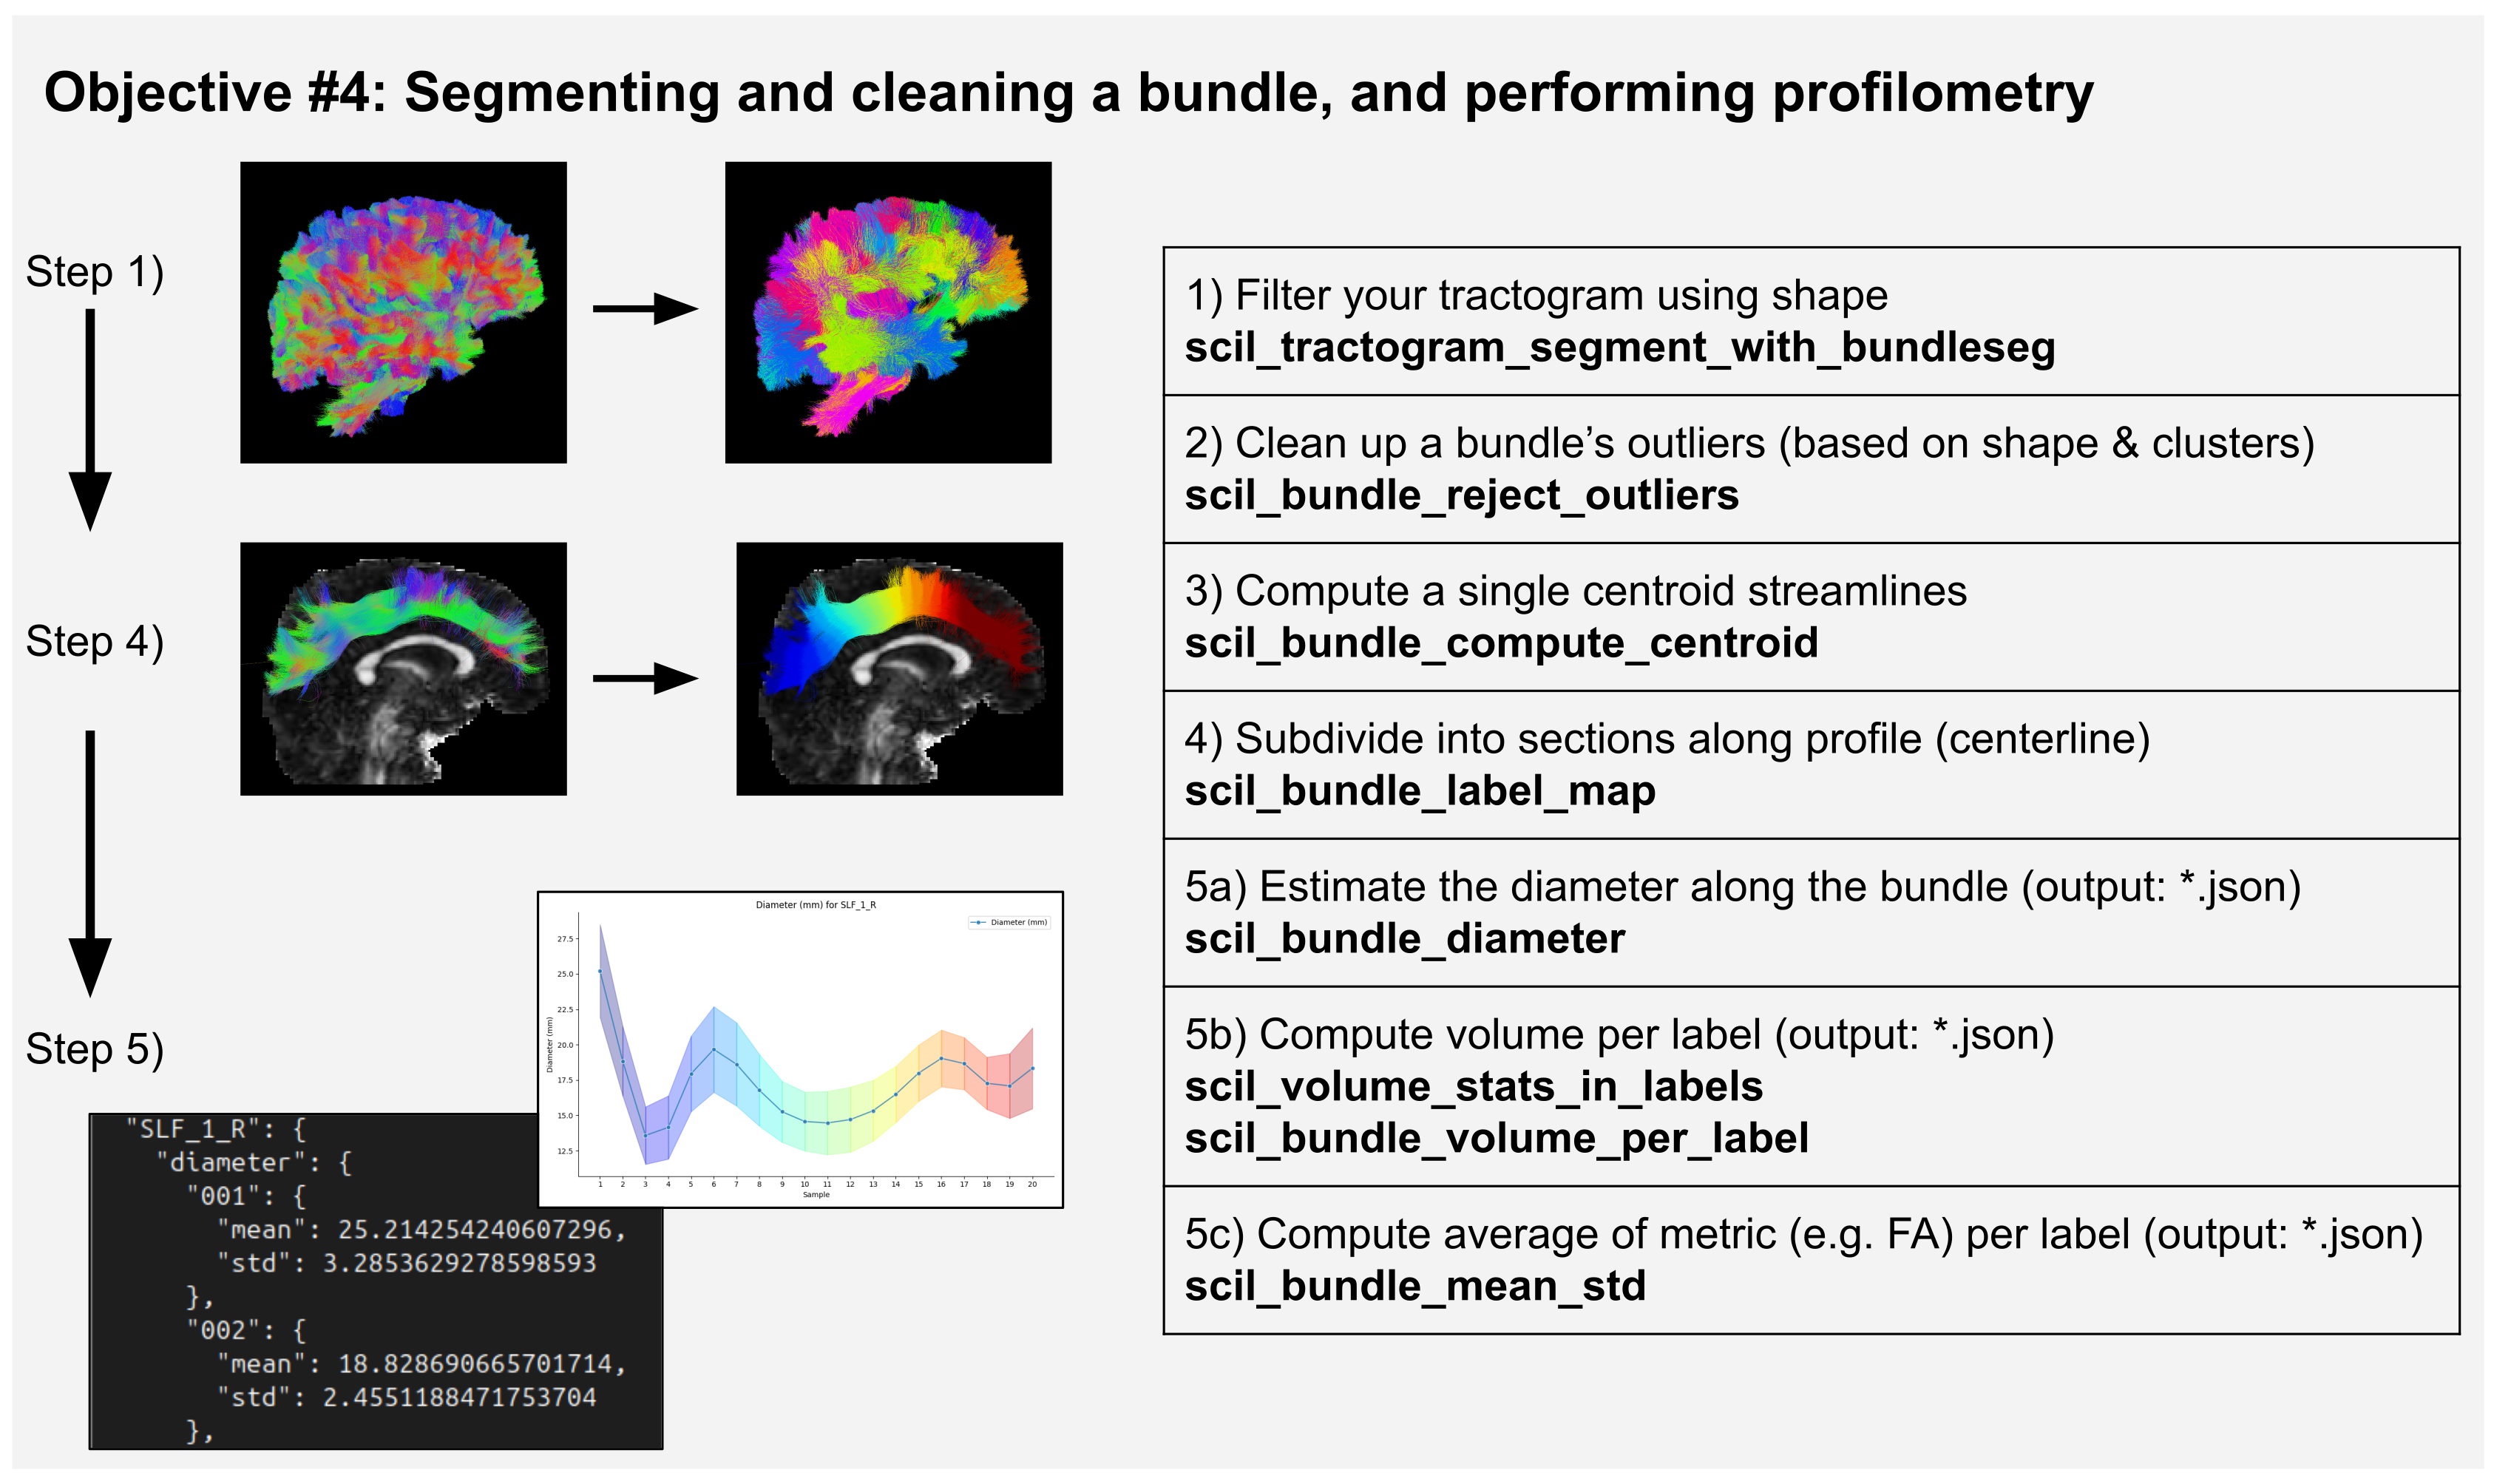
Using a clean bundle from a single subject, scilpy allows performing a profilometry [1] analysis, which is the analysis of the evolution of any dMRI metrics along its subsections. A simple example is shown in Figure 4, and for further examples of such processes, users can refer to Tractometry-flow (https://github.com/scilus/tractometry_flow), a nextflow process using many scilpy scripts, or to the study by Cousineau et. al [2].
The creation of the bundles requires tractogram segmentation (Tractogram Segmentation into bundles).
The profilometry analysis requires segmenting the bundles into as many subsections as desired. This is not straightforward, as the division of sections can be performed arbitrarily. We generally cut the section perpendicularly to the direction of the bundle, measured from a centroid, a single streamline-like shape representing the average of all streamlines in the bundle (scil_bundle_compute_centroid, scil_bundle_label_map). Then, any metric can be associated with the subsections. Figure 4 shows the example of the sections’ volume and diameter, or mean underlying value of any given map, such as the FA map. The resulting json file’s values can be plotted with scil_plot_stats_per_point.
Beyond profilometry, other analysis steps could also be performed on the whole bundle. For instance, it is possible to compute the map of the head and tail of a bundle (the starting and ending regions of the bundle, assuming all streamlines are aligned in the same direction) with scil_bundle_uniformize_endpoints and scil_bundle_compute_endpoints_map. It is also possible to extract various information with scil_bundle_shape_measures.